Select unique values in Microsoft Excel column
- Category: Excel
- Hits: 20589
Quick Count
=INT(SUMPRODUCT((A3:A1000<>"")/COUNTIF(A3:A1000,A3:A1000&"")))
This returns the number of unique values in the range A3 to A1000 and excludes the blank/empty cells.
Display all Unique
Found this note on one of Microsoft Help sites:
Stop Excel Row Height Self-Adjust on Refresh
- Category: Excel
- Hits: 52181
I have a Microsoft Excel 2007 file that connects to a SQL Server 2008 R2 database. The Excel file pulls data using lookup tables and displays the data in an Excel Spreadsheet.
The Problem
We can select all cells and set row height to be 30 for example, but everytime we refresh the data in the Excel spreadsheet, all the rows get re-adjusted to fit the data and lose that consistency.
A Workaround: New line inserted before and after
So this is where I am at the moment without VBCode and other suggestions. Instead I add a newline in front of and after the smallest data value (one that I know will never be two lines (or two words)) within the SQL query itself. We have a DEPT column that is an acronym of the departments so for example:
Excel PivotTable Filter List Ordering
- Category: Excel
- Hits: 48508
The Situation
We have an Excel report which summarizes for our guys at the top, all the activities and time spent by staff. There are several filters available on the report (only a few to keep it simple silly). When you click on the filter, a dropdown appears with all available values listed.
The Problem
The values are listed in alphabetical order at first. If any new values come along then they get added to the bottom of the list... This is the problem. For example, if the year dropdown has a list of 2010, 2011, 2013; then if you add an entry which has year 2012, then the dropdown list will be in the following order: 2010, 2011, 2013, 2012.
The Solution

Blank columns issue when exporting to Excel (Data Only) from Crystal Reports
- Category: Excel
- Hits: 85777
Following up on my article on correcting disappearing headers, a further issue with our web-report is that even an export to Excel (Data Only) from Crystal Reports 9, created extra columns. This issue could not be replicated on the client machine (ie. from my workstation). I would have to upload the report to the server, configure the web application to use the newly uploaded report, export to a Crystal Report, which in turn we export to Excel:
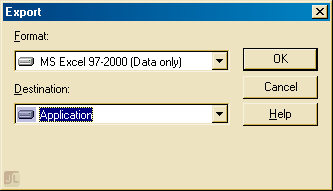
Note that as this is from within a web application, there are no extra options or dialogs to select. The export had to work from this point on. I can't take any credit for the below as it was copied from http://hosteddocs.ittoolbox.com/ST030504.pdf. A "Crystal Decisions" documentation.
Crystal Reports: Exporting to Excel omits column headers
- Category: Excel
- Hits: 45111
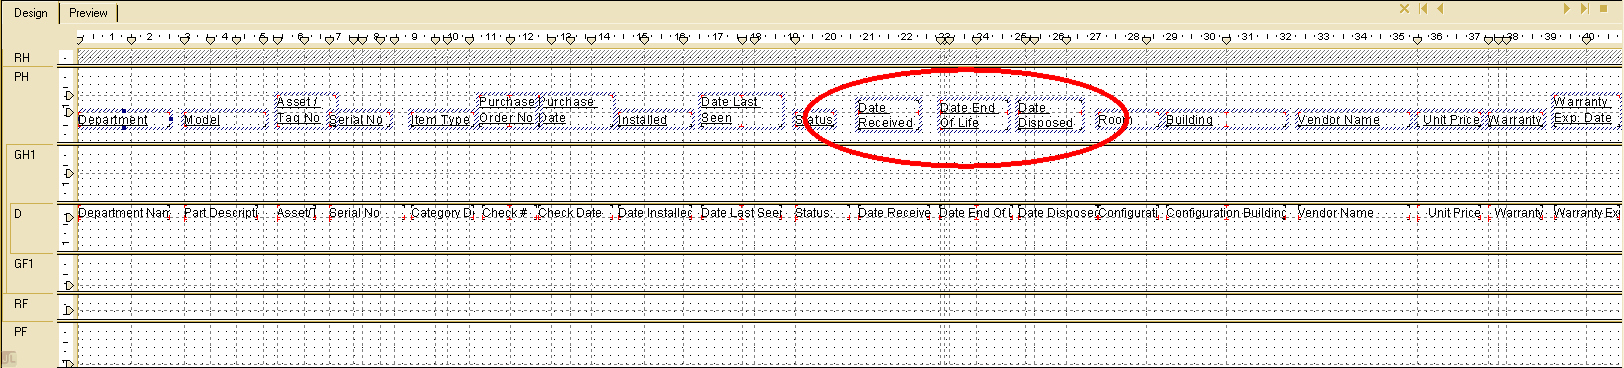
If you've been to the point where you're exporting a report to Excel, and only some of the column headers appear, then try this:
I googled this for ages and found different suggestions here and there but none of them produced consistent results. One solution was to untick "Simplify page headers" on the Excel Format Options when you export the report. Because our report is exported via a web-based system, this extra dialog doesn't appear when our users export their reports. Not that it solved it as only some different headers appeared on the exported report when we followed that suggestion.
Consider the following report in design view, only the circled headings would appear on the exported report: