Dunno about you guys but I've searched the WWW for a solution and couldn't find it. The work around I've documented is a "solution" to my situation and environment.
Our setup is:
- SQL Server 2008
- Report Builder 2.0
- BMC Service Desk Express 9.8
DataSet1:
- Incident #
- Group Name
- Close Date & Time
- Assigned to Full Name
- Incident Type
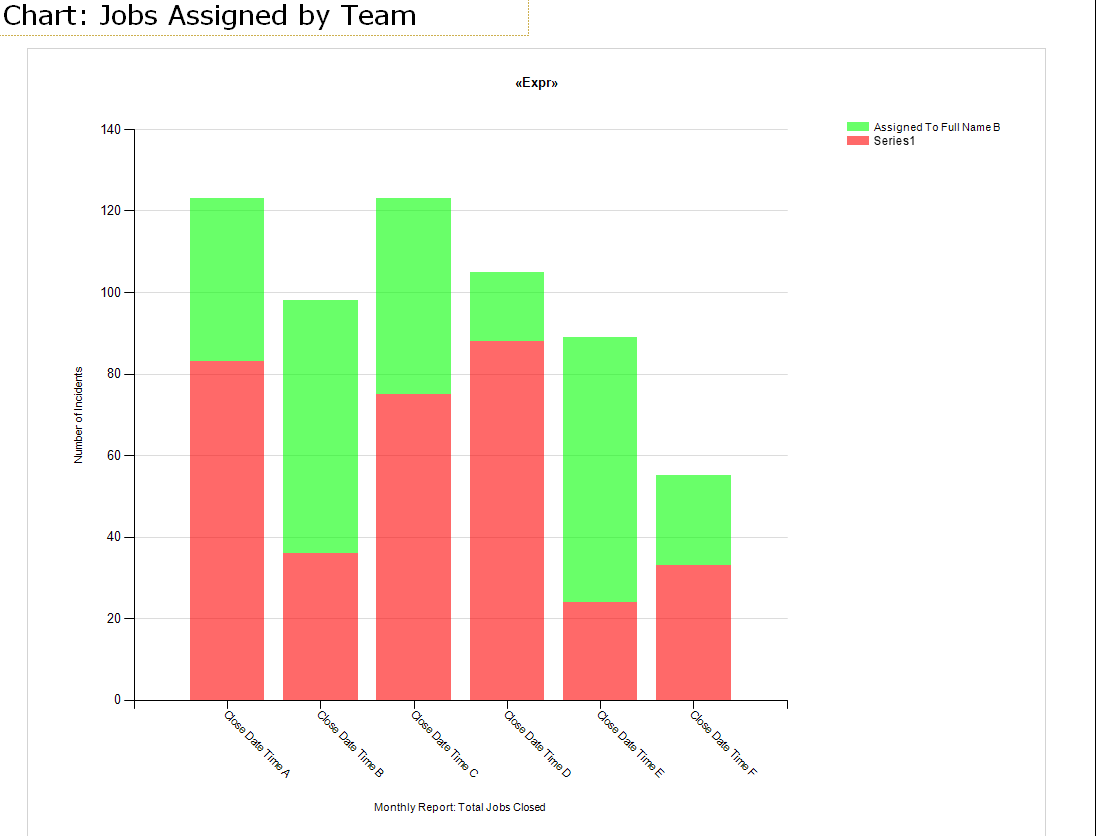
The objective of this article is to explain how to hide "Series1" from appearing in your SQL Server Reporting Service (SSRS) report. I am guessing that Series1 is the data series from an outer join where the joining index value is null.
The chart below has 3 series or data fields:
- Count the total number of incidents logged (Y-axis - data fields)
- Invidividual the incident(s) are assigned to (Labels - series fields)
- Months the incident(s) were closed (X-axis - category fields)
My SQL Query is:
copyraw
SELECT
  _SMDBA_.Incident.[Incident #]
  ,_SMDBA_.Incident.[Group Name]
  ,_SMDBA_.Incident.[Close Date & Time]
  ,_SMDBA_.Incident.[Assigned To Full Name]
  ,_SMDBA_.Incident.[Incident Type]
FROM
  _SMDBA_.Incident
WHERE
  _SMDBA_.Incident.[Group Name] LIKE @GroupName
- SELECT
- _SMDBA_.Incident.[Incident #]
- ,_SMDBA_.Incident.[Group Name]
- ,_SMDBA_.Incident.[Close Date & Time]
- ,_SMDBA_.Incident.[Assigned To Full Name]
- ,_SMDBA_.Incident.[Incident Type]
- FROM
- _SMDBA_.Incident
- WHERE
- _SMDBA_.Incident.[Group Name] LIKE @GroupName
Based on the assumption that "Series1" displays on my chart because of values that are not matched (not assigned to a current individual) in the joining tables:
- Return to the Design interface (F8)
- Right-click on your dataset (in my case: DataSet1)
- Select 'Dataset Properties'
- Add a condition to the WHERE clause
- Specify that the field name in the series fields is not blank
So I've added the AND line to the above statement yielding:
copyraw
SELECT
  _SMDBA_.Incident.[Incident #]
  ,_SMDBA_.Incident.[Group Name]
  ,_SMDBA_.Incident.[Close Date & Time]
  ,_SMDBA_.Incident.[Assigned To Full Name]
  ,_SMDBA_.Incident.[Incident Type]
FROM
  _SMDBA_.Incident
WHERE
  _SMDBA_.Incident.[Group Name] LIKE @GroupName
AND
  _SMDBA_.Incident.[Assigned To Full Name]  ''
- SELECT
- _SMDBA_.Incident.[Incident #]
- ,_SMDBA_.Incident.[Group Name]
- ,_SMDBA_.Incident.[Close Date & Time]
- ,_SMDBA_.Incident.[Assigned To Full Name]
- ,_SMDBA_.Incident.[Incident Type]
- FROM
- _SMDBA_.Incident
- WHERE
- _SMDBA_.Incident.[Group Name] LIKE @GroupName
- AND
- _SMDBA_.Incident.[Assigned To Full Name] ''
Note that this excludes all the data that doesn't have a matching label. Which can be a major part of your charts if this is a normal part of your database. In my example, the team members could have changed and that a person doing most of the jobs suddenly left or moved to another team.
To exclude the rest and only show "Series1"
Took me a while to figure this out but modify the above statement along the lines of
copyraw
SELECT
  _SMDBA_.Incident.[Incident #]
  ,_SMDBA_.Incident.[Group Name]
  ,_SMDBA_.Incident.[Close Date & Time]
  ,_SMDBA_.Incident.[Login ID Closed By]
  ,_SMDBA_.Incident.[Assigned To Full Name]
  ,_SMDBA_.Incident.[Incident Type]
FROM
  _SMDBA_.Incident
WHERE
  _SMDBA_.Incident.[Group Name] LIKE @GroupName
AND
 _SMDBA_.Incident.[Assigned To Full Name] IS NULL
- SELECT
- _SMDBA_.Incident.[Incident #]
- ,_SMDBA_.Incident.[Group Name]
- ,_SMDBA_.Incident.[Close Date & Time]
- ,_SMDBA_.Incident.[Login ID Closed By]
- ,_SMDBA_.Incident.[Assigned To Full Name]
- ,_SMDBA_.Incident.[Incident Type]
- FROM
- _SMDBA_.Incident
- WHERE
- _SMDBA_.Incident.[Group Name] LIKE @GroupName
- AND
- _SMDBA_.Incident.[Assigned To Full Name] IS NULL
Category: SQL Server Reporting Services :: Article: 262


Add comment